ORIGINAL RESEARCH
Association between depression and quality of life in older adults: primary health care
Sônia Maria SoaresI; Patrícia Aparecida Barbosa SilvaII; Joseph Fabiano Guimarães SantosIII; Líliam
Barbosa SilvaIV
I
Nurse. Ph.D. in Public Health. Professor at the Nursing School of the
Federal University of Minas Gerais. Belo Horizonte, Minas Gerais, Brazil.
E-mail: smsoares.bhz@terra.com.br
II
Nurse. Ph.D. in Nursing and Health, Nursing School of the Federal
University of Minas Gerais, Belo Horizonte, Minas Gerais, Brazil. E-mail:
patygemeasbalp2016@gmail.com
III
Physician. Ph.D. in Clinical Epidemiology, Governador Israel Pinheiro
Hospital. Belo Horizonte, Minas Gerais, Brazil. E-mail:
josephfgsantos@yahoo.com.br
IV
Nurse. Ph.D. student of the Nursing School of the Federal University of
Minas Gerais, Belo Horizonte, Minas Gerais, Brazil. E-mail: ligemeasbh@yahoo.com.br
V
Thanks go to the Foundation for Research Support of the state of Minas
Gerais for funding (# APQ-00570-09 and APQ-03626-10).
DOI:
http://dx.doi.org/10.12957/reuerj.2017.19987
ABSTRACT
Objective: to evaluate the association between depression and quality of life in
older adults. Method: in this cross-sectional study
involving 593 primary care users from Belo Horizonte, Minas Gerais, data
were obtained using a structured questionnaire, from October 2010 to June
2012, after approval by the research ethics committees of the institutions
involved (Opinions Nos. 0043.0.410.203-10 and 0043.0.410.203-10A). Data
analysis was based on descriptive techniques and forward logistic
regression. Results: the prevalence of depression was
15.5%. After controlling for confounding factors, the variables that
continued to be significantly associated with the outcome were overall
quality-of-life score lower than 60, self-reported depression, female sex,
positive Alcohol Use Disorders Identification Test-Consumption and family
income of less than three minimum wages. Conclusion: it
was concluded that it is necessary to invest in mental health and
well-being policies for older age groups and in training health personnel
in early screening for depression.
Keywords: Depression; quality of life; aged; primary health care.
INTRODUCTION
Depression is the most prevalent mental disorder, and is the second leading
cause of disability in the world after low back pain. It is associated with
worsening of the general health status, loss of disability-adjusted life
years, decreased productivity and it is a risk factor for early mortality
and suicide 1. There is also a greater use of health services
and operational costs 2.
A population-based study involving 17 countries identified the prevalence
of depression ranging from 2.2% in Japan to 10.4% in Brazil. Thus, Brazil
ranked first in the depression index compared to the other countries with
its prevalence being higher among the younger age groups (10.9% vs. 3.9%; χ 2 = 36.1; p-value <0.001)3.
In a meta-analysis involving 74 studies conducted between 1955 and 2005,
the prevalence of depressive symptoms in the geriatric population (≥60
years) was 10.3% (interquartile range 4.7% -16%) 4.
Authors warn that this variability in the prevalence of depression around
the world is attributed to the combination of genetic vulnerability and
environmental risk factors as well as cultural differences and psychometric
features of depression detection instruments. Moreover, the quality of the
methodology used to design studies should be taken into account 5.
Many risk factors for depression have been reported in the literature, such
as being female6,7, race (Asian, mulatto or indigenous), low
economic status, retired, history of heart problems, incapacity to perform
basic and instrumental activities of daily living6, low
schooling7, worse self-perception of health and dissatisfaction
of life in general6,7, high body mass index and smoking 8. Depressive symptomatology is associated with increased risk
of dementia 9, hospitalization, greater number of readmissions,
and longer hospital stay in elderly men 10 as well as all-cause
mortality 11. Studies have also shown an inverse correlation
between quality of life (QoL) and depression as well as self-perceived
health, which acts as a vulnerability factor for low QoL scores in the
elderly 12-14.
These results reinforce the importance of depression in the geriatric
population. However, although it is relevant in public health to
investigate the prevalence of depression and associated factors, it is also
necessary to analyze the impact on QoL. There is a greater investment in
research involving institutionalized and hospitalized elderly and few
studies in primary health care (PHC). Moreover, studies, where depression
is evidenced only by the participant's self-report, are less consistent.
Few studies have been concerned with categorizing participants clinically
in different depression groups, or using scales with specific cutoff points
that are indicative of categories of clinical diagnoses 14.
Hence, the objective of this investigation was to evaluate the association
between depression and QoL in the elderly attended in PHC.
LITERATURE REVIEW
The term QoL has several concepts and reflects both macrossocial and
sociodemographic influences; it is also subjective, dependent on the
interpretations and perceptions of each individual 15.
For the World Health Organization, the definition of QoL refers to
individual perception of one's own QoL, which is influenced by a range of
factors, whether physical, psychological, social or environmental 16.
However, there are many threats to the QoL of elderly people, such as
chronic non-communicable diseases, including depression. Prevention should
be widely implemented employing an interdisciplinary and intersectoral
approach to care that can contribute to the improvement of the health
status and QoL of this population 17.
It is known that geriatric depression can go unnoticed by health
professionals and family members and is probably under-treated. Its
debilitating symptoms have a negative impact on the course of life and are
associated with a decline in the general health status 18.
The unpreparedness of professionals to diagnose depression in the elderly
contributes to the low recognition rate of depressive symptoms, such as
anxiety, low self-esteem, loneliness, insomnia, helplessness and anhedonia
and the consequent delay in establishing an effective therapy to solve the
problem in the context of PHC 19.
Given the growing body of scientific evidence 2,7,20, depression
is taking on a prominent role in as a comorbidity related to old age. In
view of the above, it is recommended that all the elderly should be
evaluated for mental health in order to diagnose depression, due to its
significant repercussions.
In this setting, the performance of nurses in PHC is important, as nursing
consultations can identify depressive symptoms, causal factors and health
problems related to this morbidity 21.
METHODS
A cross-sectional study was made of 593 older adults registered in the 20
primary health care units of the Northwestern Sanitary District of Belo
Horizonte, Minas Gerais from October 2010 to June 2012.
The study sample was non-probabilistic, as it depended on spontaneous
demand and consultations programmed by the health teams during the data
collection period. Calculation of the sample size, estimated using the
Lwanga & Lemeshow formula 22, was based on the prevalence of
depression in the elderly attended at the primary health care units (30.6%) 7, with a significance level of 5% and an absolute precision of
4%. The calculated sample size was 504 elderly. The final sample totaled
605 elderly, considering 20% of possible losses and represented 1.35% of
the elderly population of the sanitary district.
The inclusion criteria were subjects of both genders, aged 60 or over,
having used primary health care services in the district and agreed to
participate in the research which included an interview. Elderly with
severe cognitive impairment [Mini-Mental State Examination - MMSE ≤ 9] were
excluded from the study because of the impossibility to complete the
questionnaire 23.
Among the 605 elderly interviewed, 12 were excluded from the present study:
three because they only completed the identification form, four because
they did not answer more than 20% of the questions of the World Health
Organization Quality of Life (WHOQOL-bref) questionnaire and five were
<60 years, totaling 593 valid questionnaires (98% of the calculated
sample).
Data collection was carried out by a previously trained team composed of
three nurses and three scientific initiation students. Eligible elderly
were approached in the primary health care units while waiting for medical
care or other services in the morning or afternoon according to the
availability of each interviewer.
Depressive symptoms were evaluated using the Patient Health Questionnaire-2
(PHQ-2), an abbreviated version of The Patient Health Questionnaire
Depression Module (PHQ-9), a self-assessment scale with the total score
ranging from 0 to 6 points; the higher the score, the greater the severity
of depressive symptoms. Depression was characterized by a score ≥ 3
(sensitivity: 83% and specificity: 92%) suggesting a probable depressive
state, according to a previous study 24. Some authors advocate
the use of the PHQ-2 instead of PHQ-9, arguing that the high performance of
the first instrument and its ease of application make its use feasible in
PHC services, where the demand for tracking different clinical conditions
is high and the time of attending people is short 25. The
abbreviated version of the World Health Organization Quality of Life
(WHOQOL-bref) in Portuguese was used to evaluate the individual's
subjective perception of QoL. This instrument is a good measure of QoL in
the elderly 13,26,27 and has been translated and validated in
Brazil 28. The WHOQOL-bref has 26 items; the first two items
assess the self-perception of QoL (here referred to as WHOQOL-1) and
satisfaction with health (WHOQOL-2). The remaining 24 items are categorized
into four domains: physical (seven items), psychological (six items),
social relationships (three items) and environment (eight items) 29. Each of the 26 items are assigned a score ranging from 1 to
5. The score for each domain is transformed into a linear scale from 0 to
100 according to the syntax proposed by the WHOQOL group 30
reflecting worse or better evaluation of the QoL.
The cutoff score adopted to classify the QoL and satisfaction with health
was 60 points (sensitivity: 95% and specificity: 54.4%). This cutoff point
suggestive of worse QoL and health dissatisfaction (score <60) was
proposed by the authors, the methodology for which is described in another
publication 27. In brief, this method is based on the
rationalization of the analysis by defining two extreme and simultaneous
groups in relation to the perception of QoL and satisfaction with health.
These groups were good QoL/satisfied (those who stated they had a good or
very good QoL and felt satisfied or very satisfied with their health) and
poor QoL/dissatisfied (those who stated they had poor or very poor QoL and
felt dissatisfied or very dissatisfied with their health) 27.
Four groups were first created to define the QoL/satisfaction groups: G1 -
Perception that the quality of life is good or very good = 381 individuals;
G2 - Perception that the quality of life is poor or very poor = 35
individuals; G3 - Satisfied or very satisfied with their health = 371
individuals; G4 - Unsatisfied or very dissatisfied with their health = 103
individuals 27.
Subsequently, good QoL/satisfied and poor QoL/dissatisfied were defined: G5
- Good or very good quality of life and satisfied or very satisfied with
their health (characteristics of G1 and G3: n = 289; 48.7%) and G6 - poor
or very poor quality of life and dissatisfied or very dissatisfied with
their health (characteristics of G2 and G4: n = 22; 3.7%) 27.
The dependent variable was depression, represented by individuals who
obtained scores greater than or equal to three in the PHQ-2 instrument.
This measure was dichotomized as PHQ ≥3 (1 = probable depression, 0 =
otherwise) 24.
Independent variables included sociodemographic characteristics, clinical
conditions, lifestyle and QoL. The sociodemographic variables were gender,
age group (60-69, 70-79, 80 or more years), marital status (presence of
spouse was defined as married or in a stable union), schooling (none; 4 or
more years) and monthly family income (<3 or ≥3 minimum wages). The
clinical conditions were number of comorbidities, self-reported
comorbidities, cognitive level, habits (alcoholism, smoking, physical
activity) and QoL [general quality of life score (GQoL): Physical,
Psychological, Social Relationships and Environment; GQoL <60 points;
QoL/satisfaction groups - G5 and G6].
The MMSE was used to assess the cognitive level; illiterate individuals
with a score <13 were categorized as altered, as were those with up to
eight years of schooling and a score <18, and those with more than eight
years of schooling and a score <26 23.
Behavioral variables were categorized as follows: smoker (currently smokes
or quit smoking within the previous 12 months), non-smoker (never smoked),
ex-smoker (quit smoking more than 12 months previously). The Alcohol Use
Disorders Identification Test-Consumption (AUDIT-C) was used to evaluate
alcohol consumption. Based on a previous validation study, a score ≥ 4 for
men and ≥ 3 for women suggests alcohol abuse and this was adopted as a
criterion in this study 31. Physical activity was considered for
those who performed physical exercises on a regular basis at least three
times per week for at least 30 minutes each session.
In the data analysis, frequencies and proportions were reported for the
categorical variables and medians and interquartile range for continuous
variables. The Kolmogorov-Smirnov test was used to analyze the normality of
continuous variables. Percentages were compared using the chi-square test.
The Mann-Whitney U test was applied to compare the medians between groups.
In the univariate analysis, a critical level for p-value ≤0.20 value was
adopted for inclusion in the multivariate model. The logistic regression
model employed the forward method to evaluate the direction and magnitude
of associations for each independent variable with the response variable
(PHQ ≥3). In this analysis, a p-value <0.05 was considered statistically
significant. The values obtained are expressed as odds ratios with their
respective 95% confidence intervals. The fit of the final model was
evaluated by the goodness-of-fit test. Receiver-operating characteristic
(ROC) curve analysis was performed to evaluate the discriminatory power of
the score of 60 and the area under the curve (AUC) in predicting good
QoL/satisfied or poor QoL/unsatisfied of the study sample. The diagnostic
test considering the cutoff point of 60 was applied to groups G5 (good
QoL/satisfied) and G6 (poor QoL/unsatisfied). The SPSS program (version
22.0) was used for all analyses.
Participation in this research was voluntary on signing an informed consent
form. The study was approved by the Research Ethics Committee of the
Federal University of Minas Gerais (# 0043.0.410.203-10) and by the Ethics
Committee of the Municipal Health Department of Belo Horizonte (#
0043.0.410.203-10A) respecting all ethical precepts 32.
RESULTS
Characteristics of the sample
The median age of participants was 70 [interquartile range: 65-75 years].
Overall, 92 (15.5%) of the subjects had a diagnosis suggestive of
depression (PHQ ≥3). Among the potentially depressed, 40 (43.5%) had scores
of six points, indicating a more severe condition. It was observed that the
group with depressive symptoms (PHQ ≥3) presented statistically lower
scores (p-value <0.001) for all components of the WHOQOL-bref. In
contrast, more than half of the sample (58.5%) scored zero in the PHQ-2
questionnaire. These individuals were four times more likely (OR: 4.01; 95%
CI: 2.87-5.93) to obtain a QoL score >60 than the others (data not
shown). Further details of the study sample are shown in Table 1.
Table 1:
Baseline characteristics - crude and adjusted analysis of the scores of the
Patient Health Questionnaire-2 (PHQ-2). Belo Horizonte, Minas Gerais, 2010
to 2012. (n = 593)
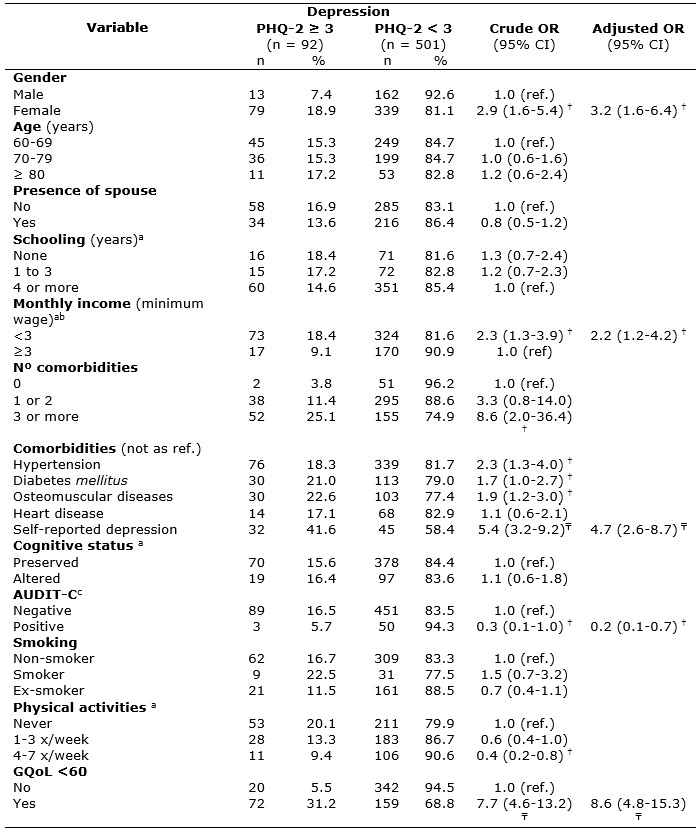
AUDIT-C: Alcohol Use Disorders Identification Test-Consumption; CI:
Confidence interval; OR: Odds Ratio; PHQ-2: The Patient Health
Questionnaire-2; GQoL: General quality of life; ref.: reference.
a Variations in total n due to missing data.
b Minimum wage during study period: R$510,00 in 2010, R$540,00 and R$545,00
in 2011, R$622,00 in 2012.
c Audit-C scores ≥ 4 for men and ≥ 3 for women suggest probably alcohol
abuse. † p-value ≤ 0.05; ₸ p-value <0.001.
Quality of life of the elderly according to the WHOQOL-bref
Approximately 64.3% of the elderly perceived their QoL as good or very good
and 5.9% as bad or very bad. Furthermore, 62.6% felt satisfied or very
satisfied with their health, while 17.4% felt dissatisfied or very
dissatisfied. Of the 381 elderly people with good or very good QoL, 75.9%
were satisfied or very satisfied with their health (Group G5 - good
QoL/satisfied). There were 35 elderly people with poor or very poor QoL; of
these, 62.9% reported dissatisfaction or greatly dissatisfied with their
health (Group G6 - poor QoL/unsatisfied). See Table 2.
Table 2:
Frequency for the WHOQOL-1 and WHOQOL-2 variables by group of quality of
life/satisfaction with health. Northwest Sanitary District, Belo Horizonte,
Minas Gerais, 2010 to 2012. (n = 593)
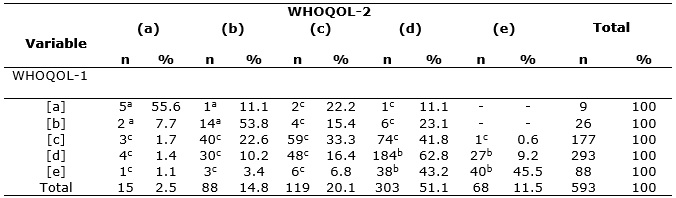
WHOQOL: World Health Organization Quality of Life
a
G6 – Poor quality of life/unsatisfied with health (n = 22).
b
G5 - Good quality of life/satisfied with health (n = 289).
c
Not defined (n = 282).
(a) Very unsatisfied; (b) unsatisfied; (c) not satisfied/not unsatisfied;
(d) satisfied; (e) very satisfied.
[a] very poor; [b] poor; [c] not poor not good; [d] good; [e] very good.
The analysis of the ROC curve indicated the critical value 60 as the best
cutoff point for the evaluation for perceived QoL and satisfaction with
health. The area under the curve was 0.764 (95% CI: 0.726-0.802; p-value:
<0.001) with a sensitivity of 80.62% and specificity of 57.57% for GQoL
≥60 in the elderly of Group G5 and sensitivity of 86.36% and specificity of
62.87% for GQoL <60 in elderly in Group G6 (Figure 1).
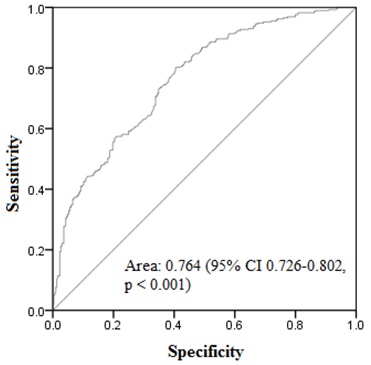
Figure 1:
ROC curve demonstrating the sensitivity and specificity of cutoff points to
predict good quality of life/satisfied with health or poor quality of
life/unsatisfied with health corresponding to groups G5 and G6,
respectively. Northwestern Sanitary District, Belo Horizonte, Minas Gerais,
2010 to 2012.
Factors associated with quality of life in the study sample
In the univariate analysis, the variables directly associated with the PHQ
scores were being female (OR: 2.9; p-value = 0.001), monthly family income
less than three minimum wages (OR: 2.3; p-value = 0.004), number of
comorbidities (OR: 8.6; p-value = 0.004 for 3 or more comorbidities),
arterial hypertension (OR: 2.3; p-value ≤0.005), diabetes mellitus (OR:
1.7; p-value = 0.040), osteomuscular diseases (OR: 1.9; p-value = 0.012),
self-reported depression (OR: 5.4; p-value <0.001) and GQoL score <60
(OR: 7.7; p-value <0.001). On the other hand, alcohol consumption (OR:
0.3; p-value = 0.049) and physical activity (OR: 0.4; p-value = 0.012 for
frequency 4 to 7 times a week) were inversely associated with depression
(Table 1).
After adjusting for the confounding variables by means of multivariate
logistic regression according to Table 1, the variables GQoL score <60
(OR: 8.6; p-value <0.001), self-reported depression (OR: 4.7; p-value
<0.001), being female (OR: 3.2; p-value = 0.001), positive AUDIT-C (OR:
0.2; p-value = 0.015) and monthly family income less than three minimum
wages (OR: 2.2; p-value = 0.012) maintained significant associations with
the outcome (PHQ ≥3). The independent variables explained 25.28% (Pseudo R2
= 0.2528) of the variability of the odds of the dependent variable. The
results of the adjustment tests of the multiple logistic regression models
(Hosmer and Lemeshow) showed a good fit in the final model (Prob.
Chi-square = 0.5549).
DISCUSSION
The prevalence of depression was high among the elderly (15.5%), however,
lower than the rates reported by other Brazilian studies at the level of
primary health care, with variations ranging from 26.1% to 30.6% 7,25,33.
A recent study in New York City, USA, involving primary care users,
identified depression by screening using the PHQ instrument to be
cost-effective with a gain of $1,726 per quality-adjusted life year. It is
known that the underdiagnosis and under-treatment of depression increases
disease burden and financial cost34.
Among the predictors of association with depression, the QoL score <60
was the independent variable with greatest power to explain the outcome;
the elderly with a QoL score <60 were 8.6 times more likely to have
depression compared to higher scores. Other studies also showed an inverse
correlation between depression and QoL, as well as self-perception of
health, which acts as a vulnerability factor for low QoL scores in the
elderly 12-14.
In addition, there was evidence of an association between depression
measured by the PHQ-2 instrument and self-reported depression. It is worth
noting that among the 92 elderly people who presented scores suggestive of
depression, 60 (65.2%) did not recognize this situation either because they
were unaware of the diagnosis or because of their resistance to having this
disease. It is known that the elderly are more susceptible to negating
mental illnesses due to their experience of a period when mental disorders
was highly stigmatized, considered a shameful state or a sign of mental
weakness 35. Another possible explanation is the tendency of the
elderly to consider depressive symptoms characteristic of the aging process 36. Geriatric depression may go unnoticed by health
professionals and family members and is probably underdiagnosed. This is of
great concern as delayed diagnosis implies a worse prognosis, and,
consequently, it negatively affects the QoL of these individuals and their
families.
An association was also found between being female and depressive symptoms
with a 3.2 times greater risk compared to males; this corroborates other
studies 6,14,37. One possible explanation for higher depression
scores in elderly women may be attributed to a greater chance of admitting
and complaining of depressive feelings than older men, who habitually hide
their feelings more. Women achieve greater longevity, but are accompanied
by a higher incidence of chronic diseases including depression and seek
health services more often than men do.
Furthermore, there was an inverse relationship between depression and
alcohol consumption. Older people with a positive screening for alcoholism
measured by the AUDIT-C were 80 times less likely to have depression than
those who did not drink alcohol, thus contradicting the literature 37. Moreover, the English Longitudinal Study of Aging (ELSA)
showed that, for both genders, the consumption of moderate levels of
alcohol was associated with better cognitive health, subjective well-being
and less depressive symptoms than if they were abstinent 38.
Consistent with previous studies, depression in the elderly was also
associated with low incomes 6,39. A study carried out in Turkey
indicated that poverty became the main social determinant for loneliness in
the elderly who, consequently, evolved with depression 39. Thus,
a satisfactory financial situation enables people to engage in
socio-cultural activities, increase purchasing power, and allows them to
meet the needs of health care, autonomy and survival.
It is worth noting that there were questions related to the adoption of a
cutoff point in the assessment of QoL using the WHOQOL-bref questionnaire 27. The test with a GQoL cutoff point of 60 had optimal
sensitivity and negative predictive value for screening elderly patients
with poor QoL/dissatisfied. The negative likelihood ratio showed that the
effect on the posttest probability for negative results is large and serves
as a good marker to track individuals with poor QoL/dissatisfied when the
GQoL is less than 60; the sensitivity was 86.36% and negative predictive
value was 99.17%.
Finally, some limitations of this investigation must be considered. First
the cross-sectional nature of the study makes it impossible to determine
causal relationships of the outcome and variables of interest. Second,
non-probabilistic intentional sampling makes it impossible to reproduce
this data in populations from other areas. Thirdly, there are few national
studies of elderly populations on the subject for comparison purposes.
CONCLUSION
The underdiagnosis of depression in the elderly is of great concern. Of the
predictors of depression, a worse perception of QoL and dissatisfaction of
health status had a greater power of explanation of the outcome. It is
necessary to invest in public policies aimed at mental health and
well-being in the most advanced age groups and in training of health
professionals for the early detection of depression.
Systematic efforts should be made to improve the living conditions and
health of the elderly, both in the context of collective and individual
care. The maintenance of the QoL is now a preponderant factor in the
context of the development of public policies related to elderly care.
Perhaps the failure of well-meaning plans are the result of disregarding
the category within a multidimensional system that suffers and all the
deprivations and limitations are reflected in its QoL.
Thus, it is hoped that this study will contribute to arouse the interest of
health professionals, especially in the context of PHC, in respect to the
early detection of depression, which can be achieved using specific tests
and the clinical evaluation.
REFERENCES
1.Institute for Health Metrics and Evaluation. The global burden of
disease: generating evidence, guiding policy. Seattle(USA): Institute for
Health Metrics and Evaluation; 2013.
2.Bock JO, Luppa M, Brettschneider C, Riedel-Heller S, Bickel H, Fuchs A.
Impact of depression on health care utilization and costs among multimorbid
patients: results from the MultiCare Cohort Study. PLoS One. 2014;
9(3):e91973.
3. Kessler RC, Birnbaum HG, Shahly V, Bromet E, Hwang I, McLaughlin KA, et al. Age differences in the prevalence and co-morbidity of DSM-IV major
depressive episodes: results from the WHO World Mental Health Survey
Initiative. Depress Anxiety.
2010; 27(4):351-64.
4.Barua A, Ghosh MK, Kar N, Basilio MA. Depressive disorders in elderly: an
estimation of this public health problem. J Int Med Sci Acad. 2011;
24(4):193-4.
5.Bromet E, Andrade LH, Hwang I, Sampson NA, Alonso J, Girolamo G, et al. Cross-national epidemiology of DSM-IV
major depressive episode. BMC Med. 2011; 9:90.
6.Bretanha AF, Facchini LA, Nunes BP, Munhoz TN, Tomasi E, Thumé E.
Depressive symptoms in elderly living in areas covered by Primary Health
Care Units in urban area of Bagé, RS. Rev bras epidemiol. 2015; 18(1):1-12.
7.Lopes NE, Librelotto RL, Souza GS, Irenio G, Alfredo CN. Screening for
depressive symptoms in older adults in the Family Health Strategy, Porto
Alegre, Brazil. Rev Saude Publica. 2014; 48(3):368-77.
8. Choi GS, Shin YS, Kim JH, Choi SY, Lee SK, Nam YH, et al. Prevalence and risk factors for depression in Korean adult
patients with asthma: is there a difference between elderly and non-elderly
patients? J Korean Med Sci. 2014; 29(12):1626-31.
9. Burton C, Campbell P, Jordan K, Strauss V, Mallen C. The association of anxiety and depression with future dementia
diagnosis: a case-control study in primary care. Fam Pract. 2013; 30(1):25-30.
10. Prina AM, Huisman M, Yeap BB, Hankey GJ, Flicker L, Brayne C, et
al. Association between depression and hospital outcomes among older men.
Can Med Assoc J. 2013; 185(2):117-23.
11. Teng PR, Yeh CJ, Lee MC, Lin HS, Lai TJ. Depressive symptoms as an independent risk factor for mortality in
elderly persons: results of a national longitudinal study. Aging Ment
Health. 2013; 17(4):470-8.
12.Sousa EL, Martins MM, Costa MS, Moreira MRC, Silva AO. Quality of life
and factors associated with the health of elderly diabetics. Rev enferm
UERJ. 2016; 24(5):e8456.
13. Campos
ACV, Ferreira
EF, Vargas
AMD, Albala
C. Aging, Gender and Quality of Life (AGEQOL) study: factors associated
with good quality of life in older Brazilian community-dwelling adults. Health Qual Life Outcomes. 2014; 12(1):166.
14.Jee YJ, Lee YB. Factors influencing depression among elderly patients in
geriatric hospitals. J Phys Ther Sci. 2013; 25(11):1445-9.
15.Gabriel Z, Bowling A. Quality of life from the perspectives of older
people. Ageing and Society. 2004; 24(5):675-91.
16.World Health Organization Quality of Life Group. The World Health
Organization Quality of Life assessment (WHOQOL): position paper from the
World Health Organization. Soc Sci Med. 1995; 41(10):1403-9.
17.Silva PAB. Factors associated with quality of life of elderly ascribed
in the Northwest Sanitary District of Belo Horizonte, Minas Gerais.
[Masters Dissertation]. Belo Horizonte (MG): Federal University of Minas
Gerais; 2012.
18.Ministério da Saúde (Br). Secretaria de Atenção à Saúde. Departamento de
Atenção Básica. Ageing and health of the elderly person. Brasília (DF):
Editora MS; 2007.
19.Fernandes MGM, Nascimento NFS, Costa KNFM. Prevalência e determinantes
de sintomas depressivos em idosos atendidos na atenção primária de saúde.
Rev RENE. 2010; 11(1):19-27.
20.Tavares DMS, Santos TG, Dias FA, Bolina AF, Ferreira PCS. Health and
leisure among elderly rural diabetics with and without indications of
depression. Rev enferm UERJ. 2015; 23(2):156-63.
21.Rodrigues LR, Silva ATM, Ferreira PCS, Dias FA, Tavares DMS. Quality of
life of the elderly with indication of depression: implications for
nursing. Rev enferm UERJ. 2012; 20(6):777-83.
22.Lwanga SK, Lemeshow S. Sample size determination in health studies: a
practical manual. Geneva(Swi): World Health Organization; 1991.
23. Bertolucci PH, Brucki SM, Campacci SR, Juliano Y. The Mini-Mental State Examination in a general population: impact of
educational status. Arq Neuropsiquiatr. 1994; 52(1):1-7.
24. Kroenke K
, Spitzer RL
, Williams JB
. The Patient Health Questionnaire-2: validity of a two-item depression
screener. Med Care.
2003; 41(11):1284-92.
25. Lino VT, Portela MC, Camacho LA, Atie S, Lima MJ, Rodrigues NC, et al. Screening for depression in low-income elderly patients at the
primary care level: use of the patient health questionnaire-2. PLoS One. 2014; 9(12):e113778.
26.Dawalibi NW, Goulart RMM, Prearo LC. Factors related to the quality of
life of the elderly in programs for senior citizens. Ciênc saúde coletiva.
2014; 19(8):3505-12.
27.Silva PAB, Soares SM, Santos JFG, Silva LB. Cut-off point for
WHOQOL-bref as a measure of quality of life of older adults. Rev Saude
Publica. 2014; 48(3):390-7.
28.Fleck MPA, Louzada S, Xavier M, Chachamovich E, Vieira G, Santos L, et
al. Application of the portuguese version of the abbreviated instrument of
quality life WHOQOL-bref. Rev Saude Publica. 2000; 34(2):178-83.
29.Fleck MPA, Leal OF, Louzada S, Xavier M, Chachamovich E, Vieira G, et
al. Development of the portuguese version of the OMS evaluation instrument
of quality of life. Rev Bras Psiquiatr. 1999; 21(1):19-28.
30.Organização Mundial da Saúde. Como pontuar o WHOQOL-bref e o WHOQOL-100
[site de Internet]. 1998. [cited in 2016 Jul 24]. Available from:
http://www.ufrgs.br/psiq/whoqol85a.html
31. Bush K, Kivlahan DR, McDonell MB, Fihn SD, Bradley KA
. The AUDIT Alcohol Consumption Questions (AUDIT-C): an effective brief
screening test for problem drinking. Arch Intern Med. 1998;
158(16):1789-95.
32.Conselho Nacional de Saúde (Br). Comissão Nacional de Ética em Pesquisa.
Resolução nº 466, de 12 de dezembro de 2012. Aprova as diretrizes e normas
regulamentadoras de pesquisas envolvendo seres humanos. Brasília (DF):
CNS;2012.
33.Sousa KA, Freitas FFQ, Castro AP, Oliveira CDB, Almeida AAB, Sousa KA.
Prevalence of depression symptoms in elderly people assisted by the Family
Health Strategy. Rev Min Enferm. 2017 [cited in 2016 Jul 17]; 21:e-1018.
Available from:
http://www.reme.org.br/exportar-pdf/ 1154/en_e1018.pdf
34.Jiao B, Rosen Z, Bellanger M, Belkin G, Muennig P. The
cost-effectiveness of PHQ screening and collaborative care for depression
in New York City. PLoS ONE. 2017; 12(8): e0184210.
35. Sheeran
T, Reilly
CF, Raue
PJ, Weinberger
MI, Pomerantz
J, Bruce
ML. The PHQ-2 on OASIS-C: a new resource for identifying geriatric
depression among home health patients. Home Healthc Nurse. 2010;
28(2):92-104.
36. Hao G, Bishwajit G, Tang S, Nie C, Ji L, Huang R. Social participation and perceived depression among elderly population in
South Africa. Clin Interv Aging.
2017; 12:971-6.
37.Prado JA, Kerr-Corrêa F, Lima MCP, Silva GGA, Santos JLF. Relations
between depression, alcohol and gender in the metropolitan region of São
Paulo, Brazil. Ciênc saúde coletiva. 2012; 17(9):2425-34.
38. Crome I, Crome P. Moderate alcohol consumption in older adults is associated with better
cognition and well-being than abstinence. Age Ageing. 2008; 37(1):120-1.
39.Yaka E, Keskinoglu P, Ucku R, Yener GG, Tunca Z. Prevalence and risk
factors of depression among community dwelling elderly. Arch Gerontol
Geriatr. 2014; 59(1):150-4.